Custom Hardspace Controller pt 5: Of TFTs, and scope creep
I'd toyed with the idea of using a TFT screen earlier during this project, but now that all the core functionality was there, I thought that it was worth revisiting the idea of showing the portrait and text of any incoming communications the player received during gameplay.
On looking at the datasheet for the ST7735-based TFT screens that I had, I realised one problem, though - the controller always wanted more than one byte per pixel of data to be transmitted to the device:
| Pixel Format | R Bits | G Bits | B Bits | Total Bits |
|---|---|---|---|---|
| R4G4B4 | 4 | 4 | 4 | 12 |
| R5G6B5 | 5 | 6 | 5 | 16 |
| R6G6B6 | 6 | 6 | 6 | 18 |
Even though the TFT screen was very small-resolution (128x160px), that still means that there's a total of 20480 pixels in the display.
Using the most compact representation (12-bit color), that still requires 30720 bytes of memory just to framebuffer the display. My microcontroller had a total of 20K RAM - clearly that wasn't going to be an option. And that was before considering the performance impact of having to pack the pixels so as to not waste the last 4 bits of each pixel. Even with that aside, unless I wanted to go back to my USB stack and implement bulk endpoints, which I didn't want to do at this time, USB HID Out packets are limited to 64 bytes over USB 1.1, so I'd be needing to transmit 480 packets (at an interval of 1ms each) to get that data over the wire. All of these things suggested I had to try something cleverer.
I started by looking at older game console tech, seeing what approaches had been done prior to 16, 24 or 32-bit color modes.
Older consoles are well-known for using palettes for their images, and while doing this research I thought, "If I could reduce the image down to 16 colors, I could encode each pixel as a 4-bit integer." Not necessarily a revolutionary thought, but sending a 64-byte palette and then 4-bit indices into that palette would already result in a near-four-fold reduction in data requiring transmission while keeping the 'decode' stage relatively simple.
However, when looking through the page on Wikipedia for console palettes it became painfully obvious that a fixed color palette would give terrible results:
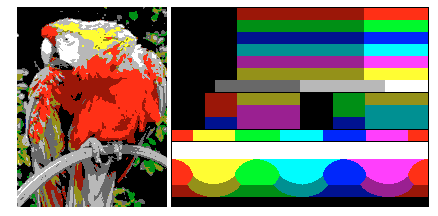
"That's okay," I thought. "I'll just reduce the image to 16 colors on-the-fly, store the resulting palette, and transmit the indices!"
Famous last words.
Problem the first: injecting a shader to do some kind of color reduction into a packaged Unity game would be problematic.
The closest I could find was something like this plugin which uses a native DLL to invoke the DirectX shader compiler, and didn't really look like it was intended for anything other than post-processing work. So, this was going to have to be something CPU-driven.
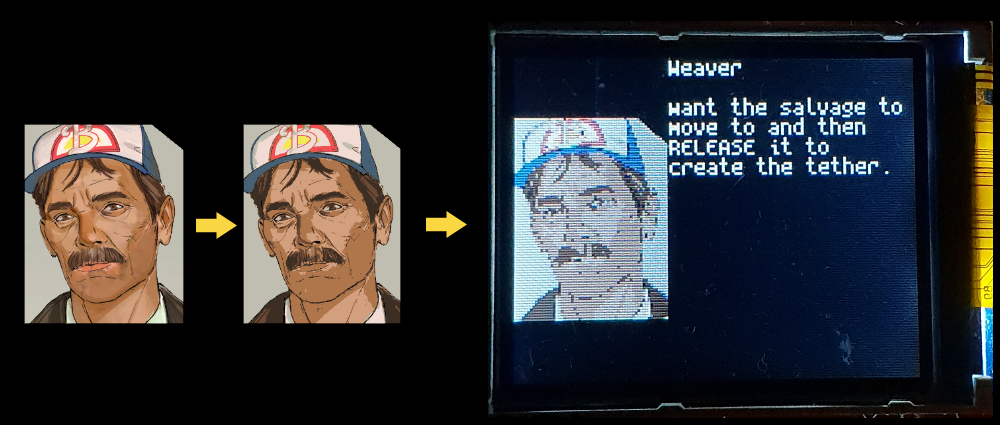
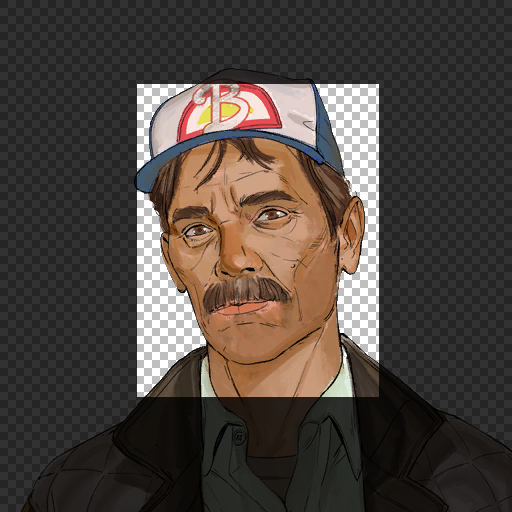
Problem the second: The portrait image was fed to a UI shader. The shader wasn't actually accessible to me, because it was compiled to SMOL-V bytecode which proved very problematic to decompile. However, I was able to reverse-engineer the presumed behaviour on the basis of the input textures to the material which consumed the shader. As best I could surmise, the shader composited the portrait onto a background image using the inverted alpha channel of the portrait, which was then being masked off against another texture for the cut-off corner, and the result was likely being UV-manipulated when presented in-game, because there was a large amount of empty space around that mask. So I'd have to do some pre-processing on the portrait image in order to have the correct data to send to the display.
Given the aforementioned restriction about shaders, I knew I was going to have to do alpha blending on the CPU, so reducing the number of pixels to work on by cropping the input images before doing the computation made sense. I couldn't see an easy way to calculate the crop region from UV coordinates or similar, though, so I decided to approximate it using the mask.
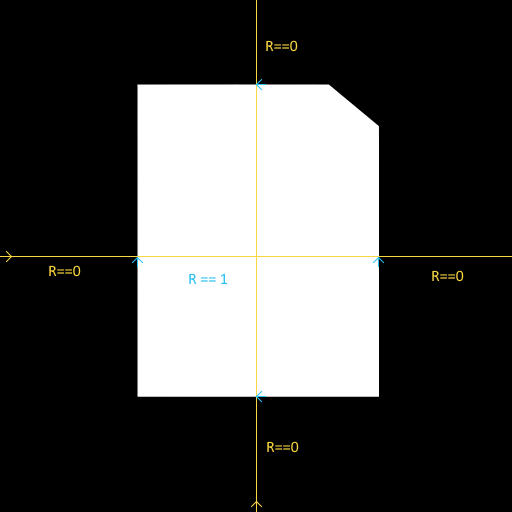
The mask had multiple channels packed in it, and the red channel was the one that defined the region for the portrait. So I'd need to inspect red pixels only. If I wanted to know the axis-aligned bounding box of the red region, I'd need to scan through the image to detect where red values started to occur and where they stopped.
Because I had the advantage of seeing the mask texture in use, I knew that I didn't need to scan the whole image for transitions between R==0 and R == non-zero, I could get away with only scanning through the center of the image, as I knew it was at its widest in the centre. So determining the AABB of the crop region looked something like this:
// Horizontal axis detection
//Loop through all the pixels in a single row at the center y coordinate of the image
for (int CurrentPixelIndex = (int)CenterCoord.y * MaskTexture.width;
	CurrentPixelIndex < (int)(CenterCoord.y + 1) * MaskTexture.width; CurrentPixelIndex++)
{
	// If the previous pixel value didnt match our threshold, ie we are still at R == 0
	if (!PreviousPixelValue)
	{
		// Check the next pixel to see if we have a non-zero value (ie a transition)
		if (MaskPixelData[CurrentPixelIndex].r > 0)
		{
			// If we do, this is where the region where red channel has positive values and we
			// want to begin our bounding box here
			PreviousPixelValue = true;
			StartX = CurrentValue;
		}

	}
	else // The previous pixel had an R value > 0
	{
		// So now we look for a transition back to 0
		if (MaskPixelData[CurrentPixelIndex].r == 0)
		{
			// when we find it, we know that we're at the end of our bounding box on the X axis
			PreviousPixelValue = false;
			EndX = CurrentValue;
			break;
		}

	}
	CurrentValue++;
}
With the coordinates calculated, it was a simple matter of calling GetPixels on each of the input textures and passing the bounding box of the region, and then I had nicely cropped input textures.
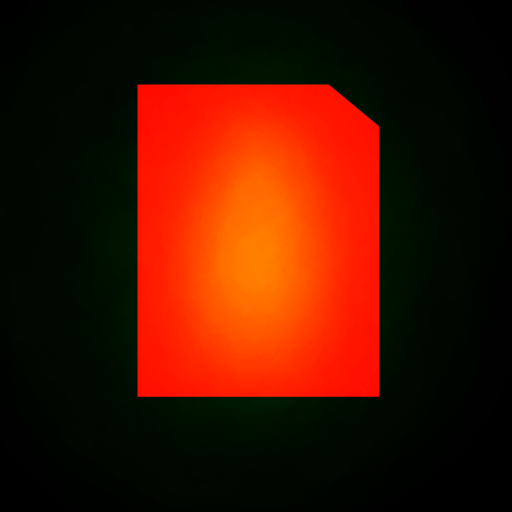
A simplified visual depiction of the actual masking process is as follows:
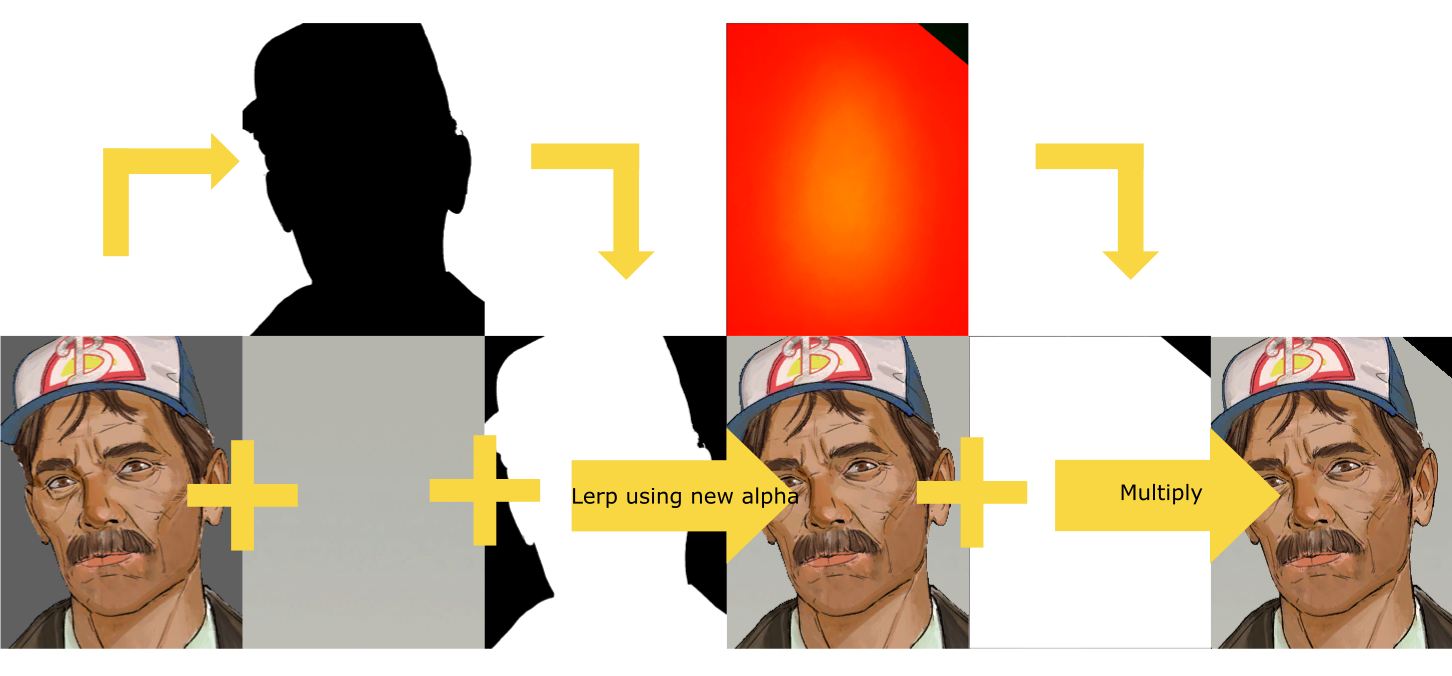
Of course, the code for this is even simpler, because we can take advantage of the fact the alpha values are 0->1 so we can subtract the current value from 1 to invert it:
for (int i = 0; i < CroppedPortraitColors.Length; i++)
{
	//Blend the portrait against the background using the inverted alpha
	CroppedPortraitColors[i] = Color.Lerp(
		CroppedBackgroundColors[i],
		CroppedPortraitColors[i],
		1 - CroppedPortraitColors[i].a
	);
	//Multiply the resulting image against the mask packed in the red channel of the mask provided
	CroppedPortraitColors[i] = Color.Lerp(
		Color.black,
		CroppedPortraitColors[i],
		CroppedMaskColors[i].r > 0f ? 1 : 0
	);
	//Color tint pulled from the material
	CroppedPortraitColors[i] = Color.Lerp(
		CroppedPortraitColors[i],
		CroppedPortraitColors[i] * LinearToSRGB(new Color(18.80893f, 11.09958f, 5.057116f)),
		0.0231f
	);
}
So, I finally had the processed image, which was a reasonable approximation for what the original in-game shader created. Now to just call "GeneratePalette" and/or "ReduceColorDepth"....
What do you mean, there aren't any such functions in Unity's provided libraries?
Sigh. Scope creep, my old friend...
So, I was going to have to implement this myself. Similarly to the preprocessing step, I was going to have to do this on the CPU. Okay, what C#-based libraries were out there for performing color quantization/color reduction?
A short search found PnnQuant.cs, a C# implementation of 'Fast Pairwise Nearest Neighbour' color quantization. What interested me in this algorithm was its relative simplicity (I have no higher mathematics qualifications, and wanted something I could understand), the fact that it is an exact algorithm rather than approximating when determining the nearest neighbour, and most importantly its ability to generate high quality results when the size of the output palette was under 256 (A lot of other algorithms seem to generate best results with an 8-bit palette).
For an explanation of the basics of the algorithm, please read this, specifically the sections 2 through 2.4. Substitute 'original color' for the phrase 'training vector' when you see it, and 'output color in the palette' when the text refers to 'code vectors'.
However, that specific implementation used types from the System.Drawing namespace, which isn't guaranteed to be provided in the mono .NET runtime that Hardspace was targeting via Unity. I didn't want to have to link against that assembly if at all possible, and it looked like it was going to be very painful to modify that implementation to use Unity color types instead, so I looked into implementing the algorithm myself natively in Unity.
It. was. so. slow.
The original, very naiive C# implementation took upwards of 5 seconds to reduce an approx 320x200 image from 5k colors to 16. Looking into ways I could boost performance, I profiled the implementation as a baseline, and begun porting portions of the implementation over to Unity's Job system. This paid dividends, reducing the time per iteration to 0.2ms, but that still resulted in a run-time of at least a second. I could Job-ify my code, but by decompiling the game logic and implementing the quantization in that library, I was using the Visual Studio toolchain which didn't compile my jobs to native code via Burst.
On the off-chance that Burst would give me significantly more perforomance, I moved my code into a new blank Unity project, matching the same versions of Burst and so on that the game was using, and used the Unity editor to compile and benchark the performance. This did reduce the runtime further, down to approximately 700ms per image, but that was still far too slow for runtime usage.
In addition, the game used a version of Burst that did not allow me to load external Bursted code, so I was left unsure that I'd have been able to run it in the context of the game anyway.
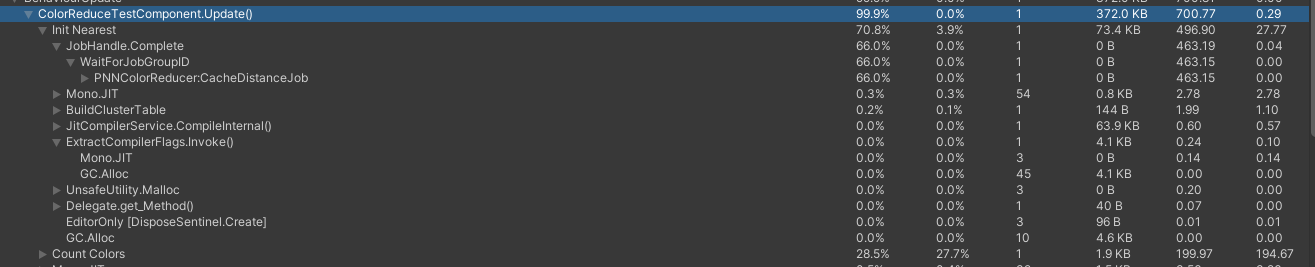
At this point I was convinced that I'd need to implement a pure native code version of the algorithm. I wrote one up as a DLL over the course of a day or so, and as suspected, immediately had a further performance boost, from 700ms to 200ms:

I suspected that while each Job may be relatively efficient, the overhead of native<->managed interop was such that it was still killing performance. Keeping the entire process on the native side was a large part of this difference in speed, I surmised, so I started to look for further ways I could optimize the performance of the native implementation.
I knew that one of Burst's key advantages was that amongst other things it used SIMD instructions to perform more work at once on the CPU. So, I thought I'd investigate SIMD intrinsics and possibly port my implementation to SIMD to try to gain a speedup beyond what simple multithreading could accomplish, especially as I suspected that synchronization between a large number of threads would actually be quite counterproductive.
I knew from my profiling of the C# implementation that I was spending quite a large amount of time performing distance calculations whenever I needed to update clusters with their nearest neighbour, after merging the smallest cluster into the remaining ones. It seemed like optimizing the performance of the distance calculation would be ideal, especially if I could cache all of the distances during an up-front calculation and simply store or update indices during algorithm iteration.
So, I started to look through SIMD instructions for my CPU (a Zen 2 -based Ryzen 3900x) to see what I could do to use approximate distances instead of exact. So long as my method would generate an approximate distance that always compare accurately based on the real distance (that is, if RealDistance(A, B) > RealDistance(A, C), then MyApproxDistance(A, B) > MyApproxDistance(A, C)), then I could claw back some CPU cycles.
I'd used approximate squared distance previously in the Unity implementation, but that still seemed to have a larger number of multiplications than I wanted. I then came across the SSE-based _mm_sad_epu8 intrinsic, which corresponds to the PSADBW assembly mnemonic.
__m128i FirstVal = _mm_set_epi32(0,0,0,First);
__m128i SecondVal = _mm_set_epi32(0,0,0,Second);
__m128i Distance = _mm_sad_epu8(FirstVal, SecondVal);
uint32_t Result;
_mm_storeu_si32(&Result, Distance);
The way this instruction works is as follows:
Compute the absolute differences of packed unsigned 8-bit integers in a and b, then horizontally sum each consecutive 8 differences to produce two unsigned 16-bit integers, and pack these unsigned 16-bit integers in the low 16 bits of 64-bit elements in dst.
A visual explanation of this with R8G8B8A8 color, where a pixel's four 8-bit integers are combined into a single 32-bit integer (only using a single element in the registers for simplicity, and omitting the upper 2 32-bit elements in the register for space):
Compute the absolute differences of packed unsigned 8-bit integers in a and b
| Op | 07 | 06 | 05 | 04 | 03(R) | 02(G) | 01(B) | 0(A) |
|---|---|---|---|---|---|---|---|---|
| a | 0 | 0 | 0 | 0 | 20 | 48 | 166 | 255 |
| b | 0 | 0 | 0 | 0 | 90 | 28 | 64 | 128 |
| Result | 0 | 0 | 0 | 0 | 70 | 20 | 102 | 127 |
horizontally sum each consecutive 8 differences to produce two unsigned 16-bit integers, and pack these unsigned 16-bit integers in the low 16 bits of 64-bit elements in dst
(Remember, I'm only showing the low half of the register, so this same process occurs to the upper 8 elements simultaneously)
| Op | 07 | 06 | 05 | 04 | 03(R) | 02(G) | 01(B) | 0(A) |
|---|---|---|---|---|---|---|---|---|
| a | 0 | 0 | 0 | 0 | 70 | 20 | 102 | 127 |
| Result | 0 | 0 | 0 | 0 | 0 | 0 | 1 | 63 |
70 + 20 + 102 + 127 = 319 which won't fit in a single byte, which is why this instruction stores the sum in a 16-bit integer (so it has enough room), and then that unsigned 16-bit integer is packed across the bottom two 8-bit elements of this part of the register (1 * 256 + 63 = 319).
This breakdown is entirely conceptual though - the calculation performed above, is done in a single step! If I manually implemented either this or an approximation via squared distances, it would consume significantly more CPU cycles.
Even better, remember, this only depicts the bottom half of the register! SIMD instructions process the entire register at once, so I could store a second pair of colors in the upper half of the register, and increase the processing speed further.
In my actual implementation, I doubled this again, to process four distance calculations at once, by using the AVX2 intrinsic _mm256_sad_epu8 which as the name implies, processes 256 bits at once (double that of the mm version).
I was then able to combine this with what are known as shuffle instructions, to actually load 8 values in from memory at once, and perform two _mm256_sad_epu8 on two separate 4-value groups from that, for a further increase in performance because I only needed to load data in from memory half as often.
//Calculates the distance from SourceColor to the eight 32-bit colors packed into memory starting at InnerIndex
auto RawTargetColors = _mm256_load_si256(reinterpret_cast<const __m256i*>(&ColorClusters.ClusterColor[InnerIndex]));
auto TargetColorsLow = _mm256_unpacklo_epi32(RawTargetColors, _mm256_setzero_si256());
auto TargetColorsHigh = _mm256_unpackhi_epi32(RawTargetColors, _mm256_setzero_si256());

auto HighDistances = _mm256_sad_epu8(TargetColorsHigh, SourceColor);
auto LowDistances = _mm256_sad_epu8(TargetColorsLow, SourceColor);
auto Results = _mm256_castps_si256(_mm256_shuffle_ps(_mm256_castsi256_ps(LowDistances), _mm256_castsi256_ps(HighDistances), (1 << 3) | (1 << 7)));
_mm256_storeu_si256(reinterpret_cast<__m256i_u*>(&CachedColorDistances[StartOffset + InnerIndex]), Results);
By the time I had finished reimplementing my native quantizer using AVX2 I'd managed to get the performance for reducing 5k colors -> 16 across a 240x312 pixel image down to 100ms. The display I wanted to use only 128x160 pixels in size, and I wanted to leave enough room for displaying the actual text of an incoming message, so I decided to scale the image down to 60x80px before doing the color reduction, cutting the time down to around 30ms which was acceptable enough for realtime use.
In addition to implementing the actual color reduction algorithm (and returning the palette data), I also added a second function using SIMD to pack the indexed colors into the nibbles of bytes, ready for transmission to the controller.
With the data all ready for transmission to the controller, I then started to work on the actual firmware portion responsible for the communication between the controller and the display.
The first task I set for myself was to read the Device ID register from the display in order to ensure that I had the SPI peripheral configured correctly.
However, this was more complicated than it sounded, because the display uses a special 3-wire SPI configuration with a bidirectional data line, and a requirement for an extra clock pulse to be given at the right time when transitioning between sending the command code, and releasing the data line so the display could drive it to transmit the relevant data back. While the SPI peripheral on the STM32L073 supports this mode, it is tricky to use, as once configured for reception of the data back from the slave device (bidirectional mode enabled, bidirectional direction = receive), the peripheral sends clock pulses as soon the enable flag is set, which can potentially result in extra clock pulses being sent, and data corruption or loss as a result. As a result, sending the extra pulse that the ST7735 requires has to be done manually, as the peripheral will generate multiple pulses before it can be disabled again.
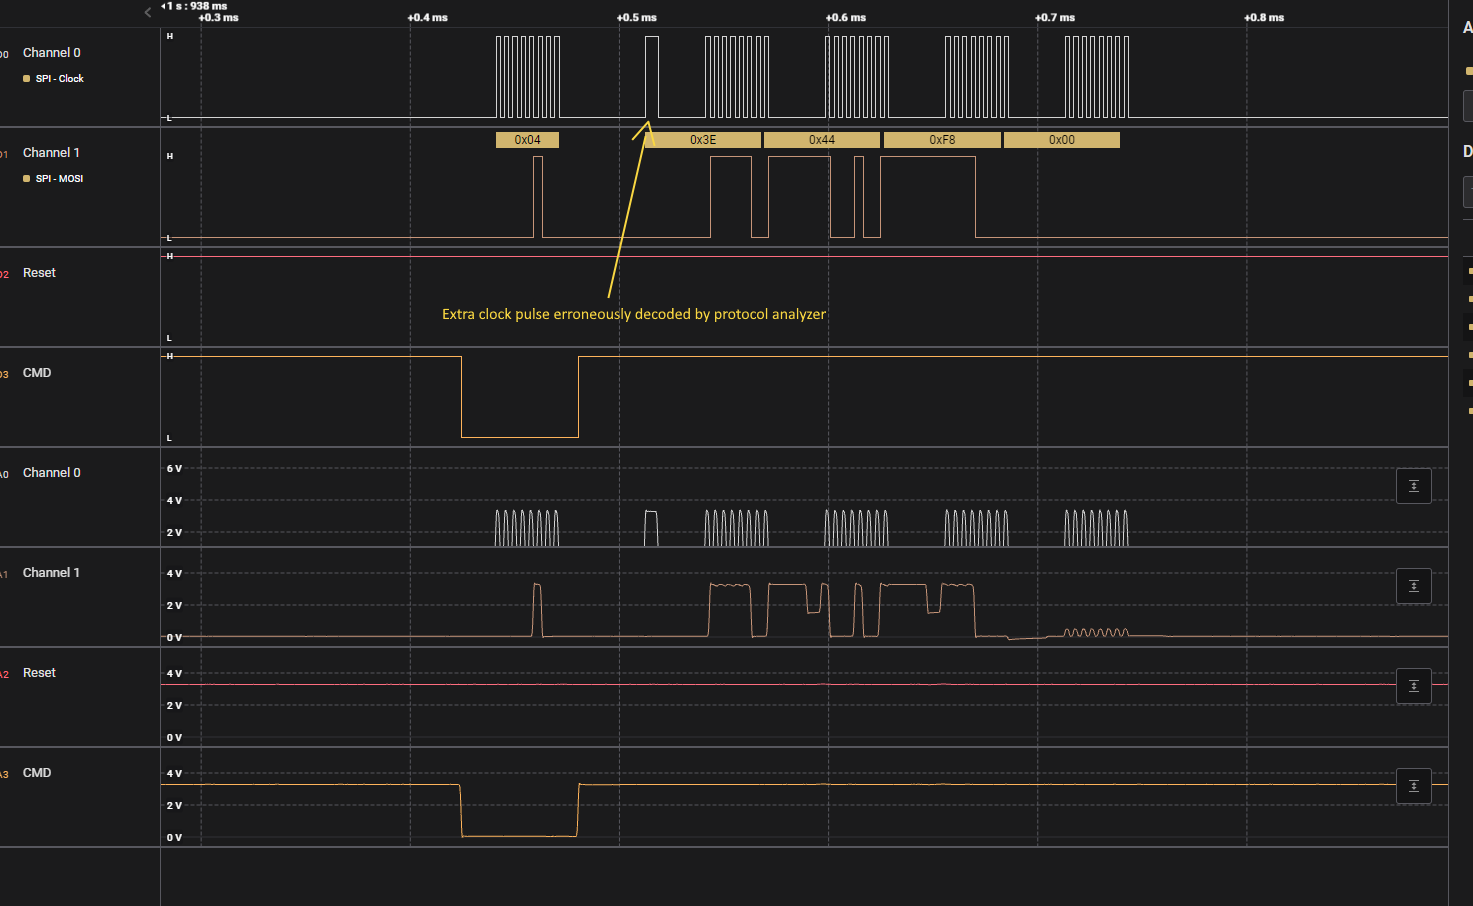
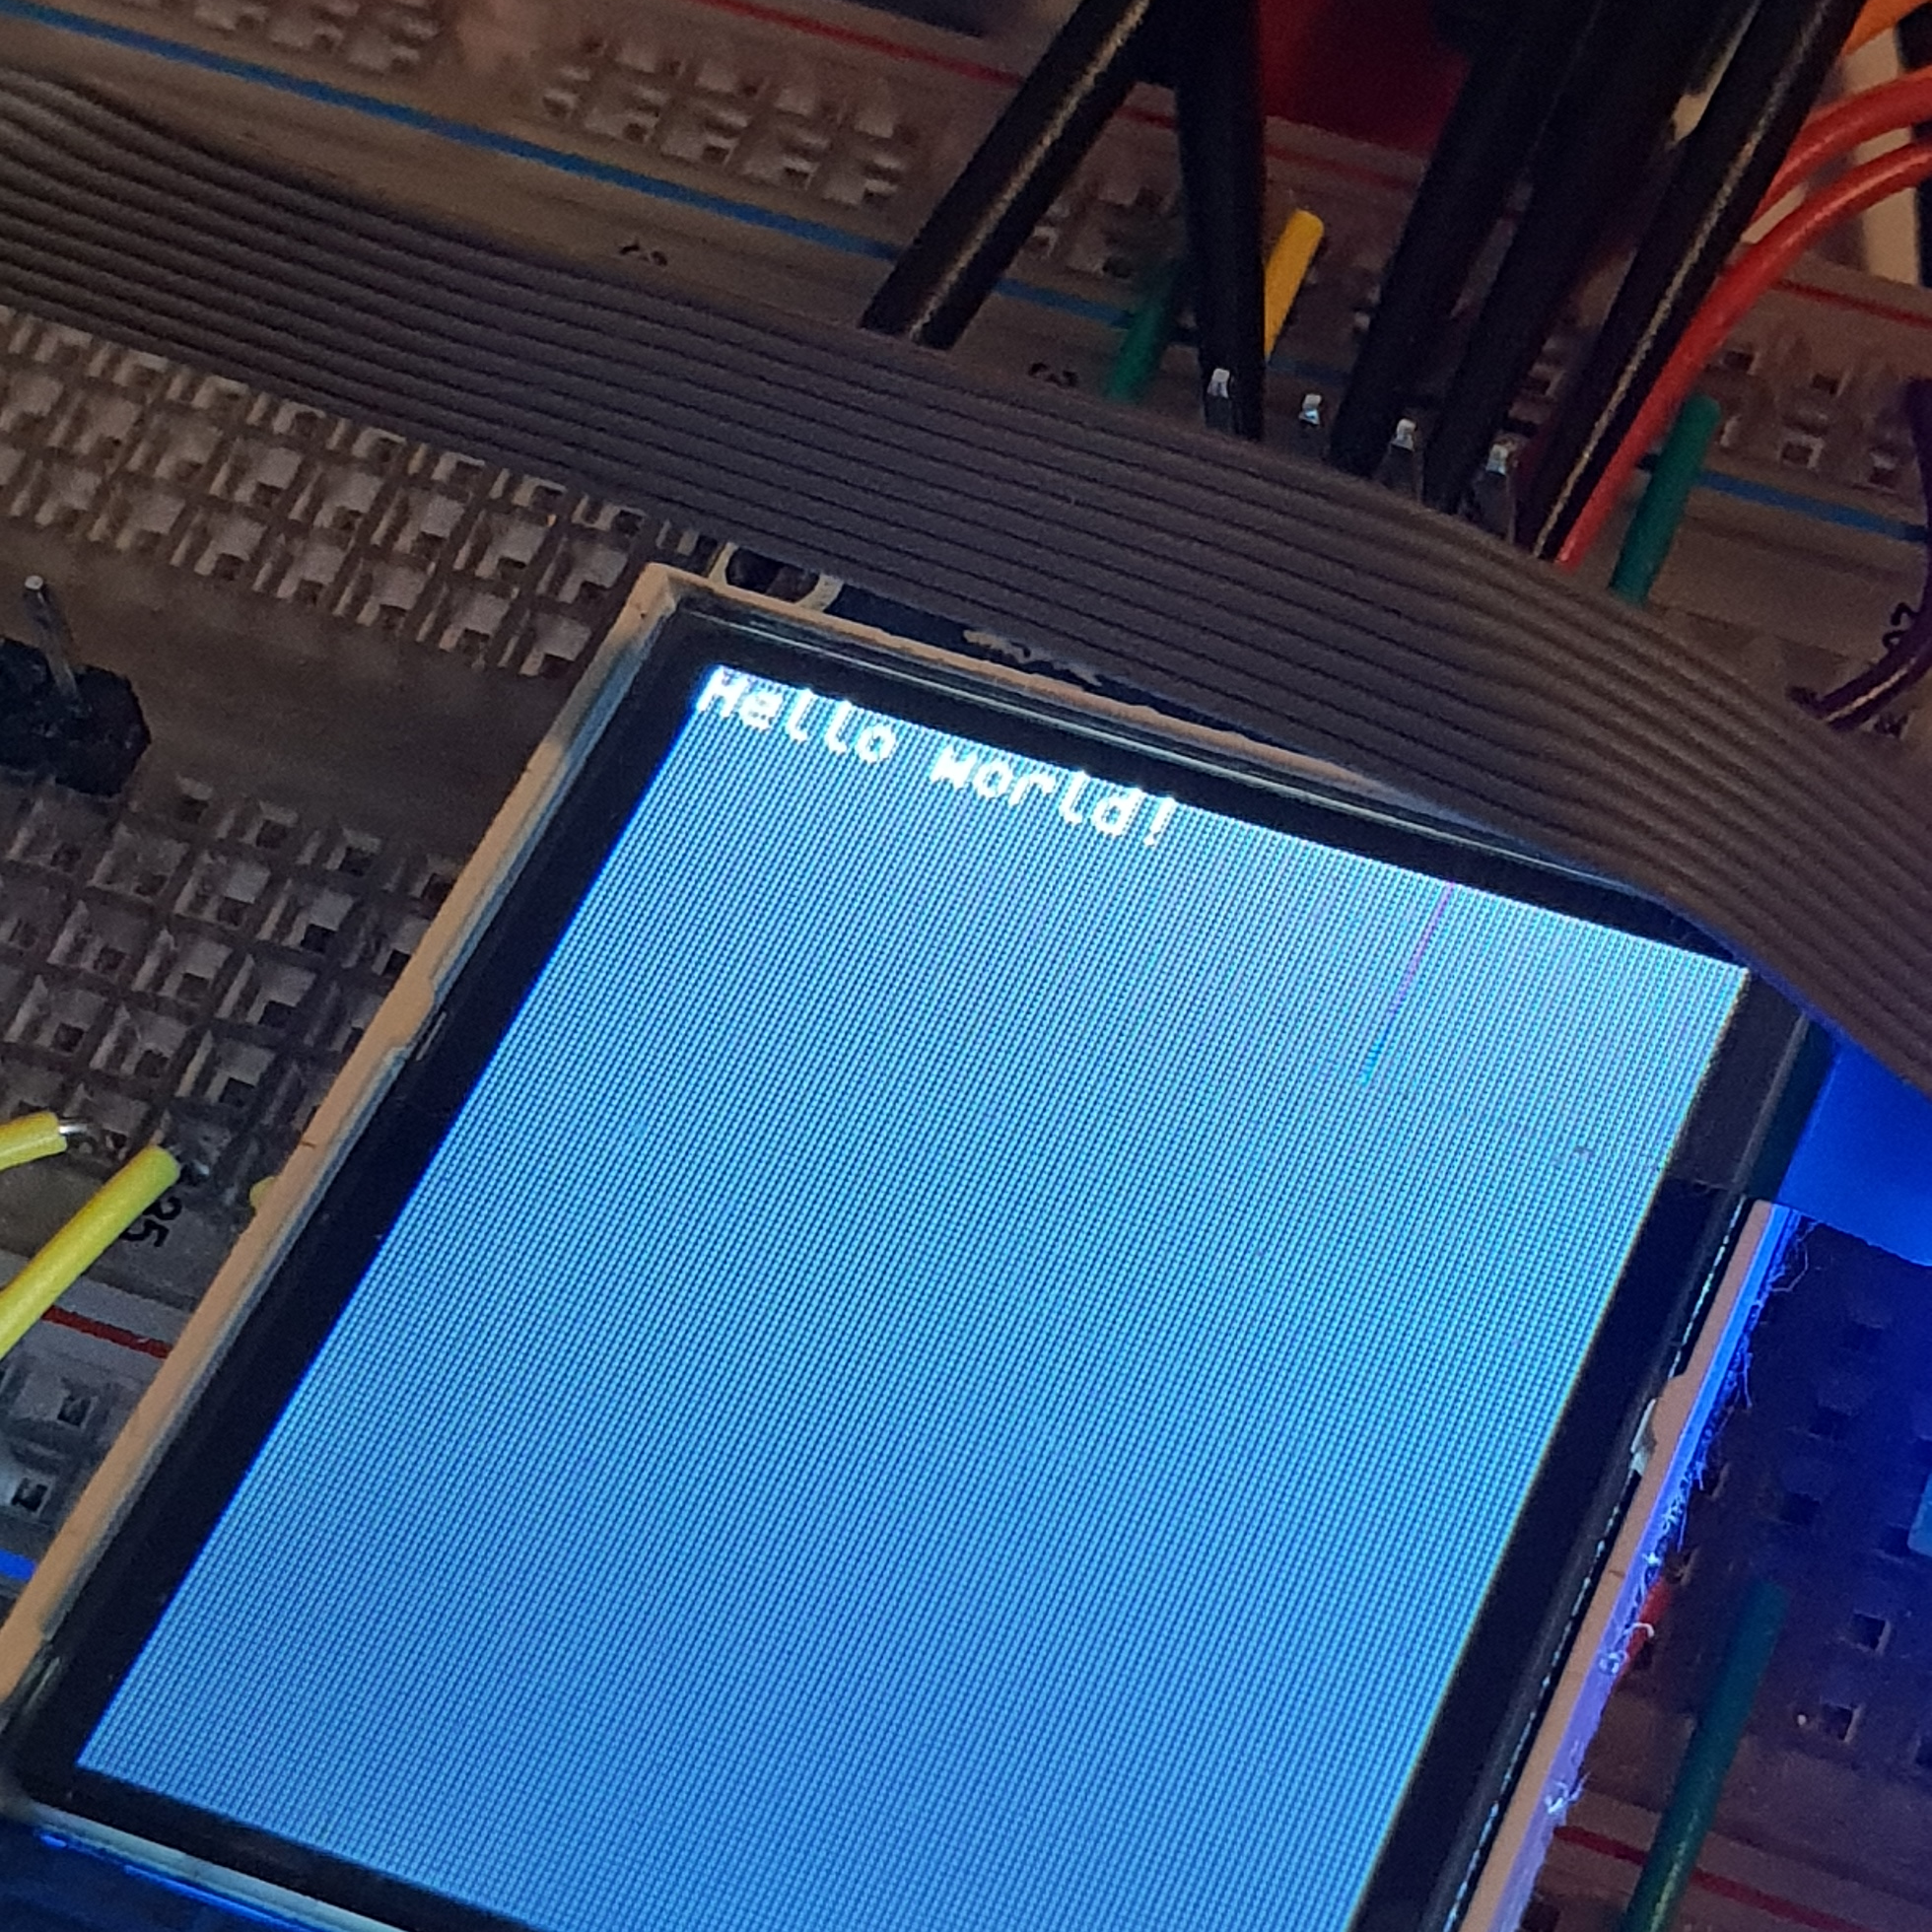
Using my Saleae Logic analyzer, I was able to inspect the data and confirm that I was communicating correctly with the display. The Saleae is a bit like the J-Link in that it's a bit more expensive than generic equivalents, but it's well built and has excellent software support. As a result, it's pretty much the first tool I turn to when needing to verify signaling like this, especially at faster frequencies.
The additional clock pulse tricked the analyzer's built-in protocol decoder, causing every data byte to be shifted across by one bit, but I knew a) that if I really wanted to I could write a custom decoder for the display, because Saleae provide a solid SDK for custom analyzers and b) I could manually write out the binary myself to confirm the values were correct. I felt lazy, so I chose the latter. :P
With communication verified between the controller and the display, I had three next steps:
- Initialize the display correctly
- Draw a line to the display
- Draw text on the display
Initialization was comparatively straight forward based on the information in the data sheet, with the following caveats:
- Reset pin must be driven low for a minimum of 10ms
- No commands should be sent for 120ms after reset pin is allowed to go high
- You must request the display leave sleep mode, and then request that it leave idle mode to get expected behaviour
This last point can't be emphasised enough. I was very frustrated for a few hours wherein it didn't seem like I was initializing the display properly, the color mode was wrong or something else. I eventually realised that the display defaults to 'idle mode' which forces an 8-color restricted palette. Once I identified this, the configuration code post-reset looked like the following:
SendCommand(Command::LeaveSleep);
SendCommand(Command::EnableNormalDisplayMode);
SendCommand(Command::DisableInvertedColors);
SetMemoryParams(ST7735S::VerticalDirection::BottomToTop, ST7735S::HorizontalDirection::LeftToRight, true,
				ST7735S::VerticalDirection::BottomToTop, ST7735S::ChannelOrder::RGB,
				ST7735S::HorizontalDirection::LeftToRight);
SendCommand(Command::LeaveIdleMode);
SetColorMode(ST7735S::ColorMode::R5G6B5_16Bit);
SetGamma(ST7735S::GammaPreset::Curve3_22);
SendCommand(Command::DisplayOn);
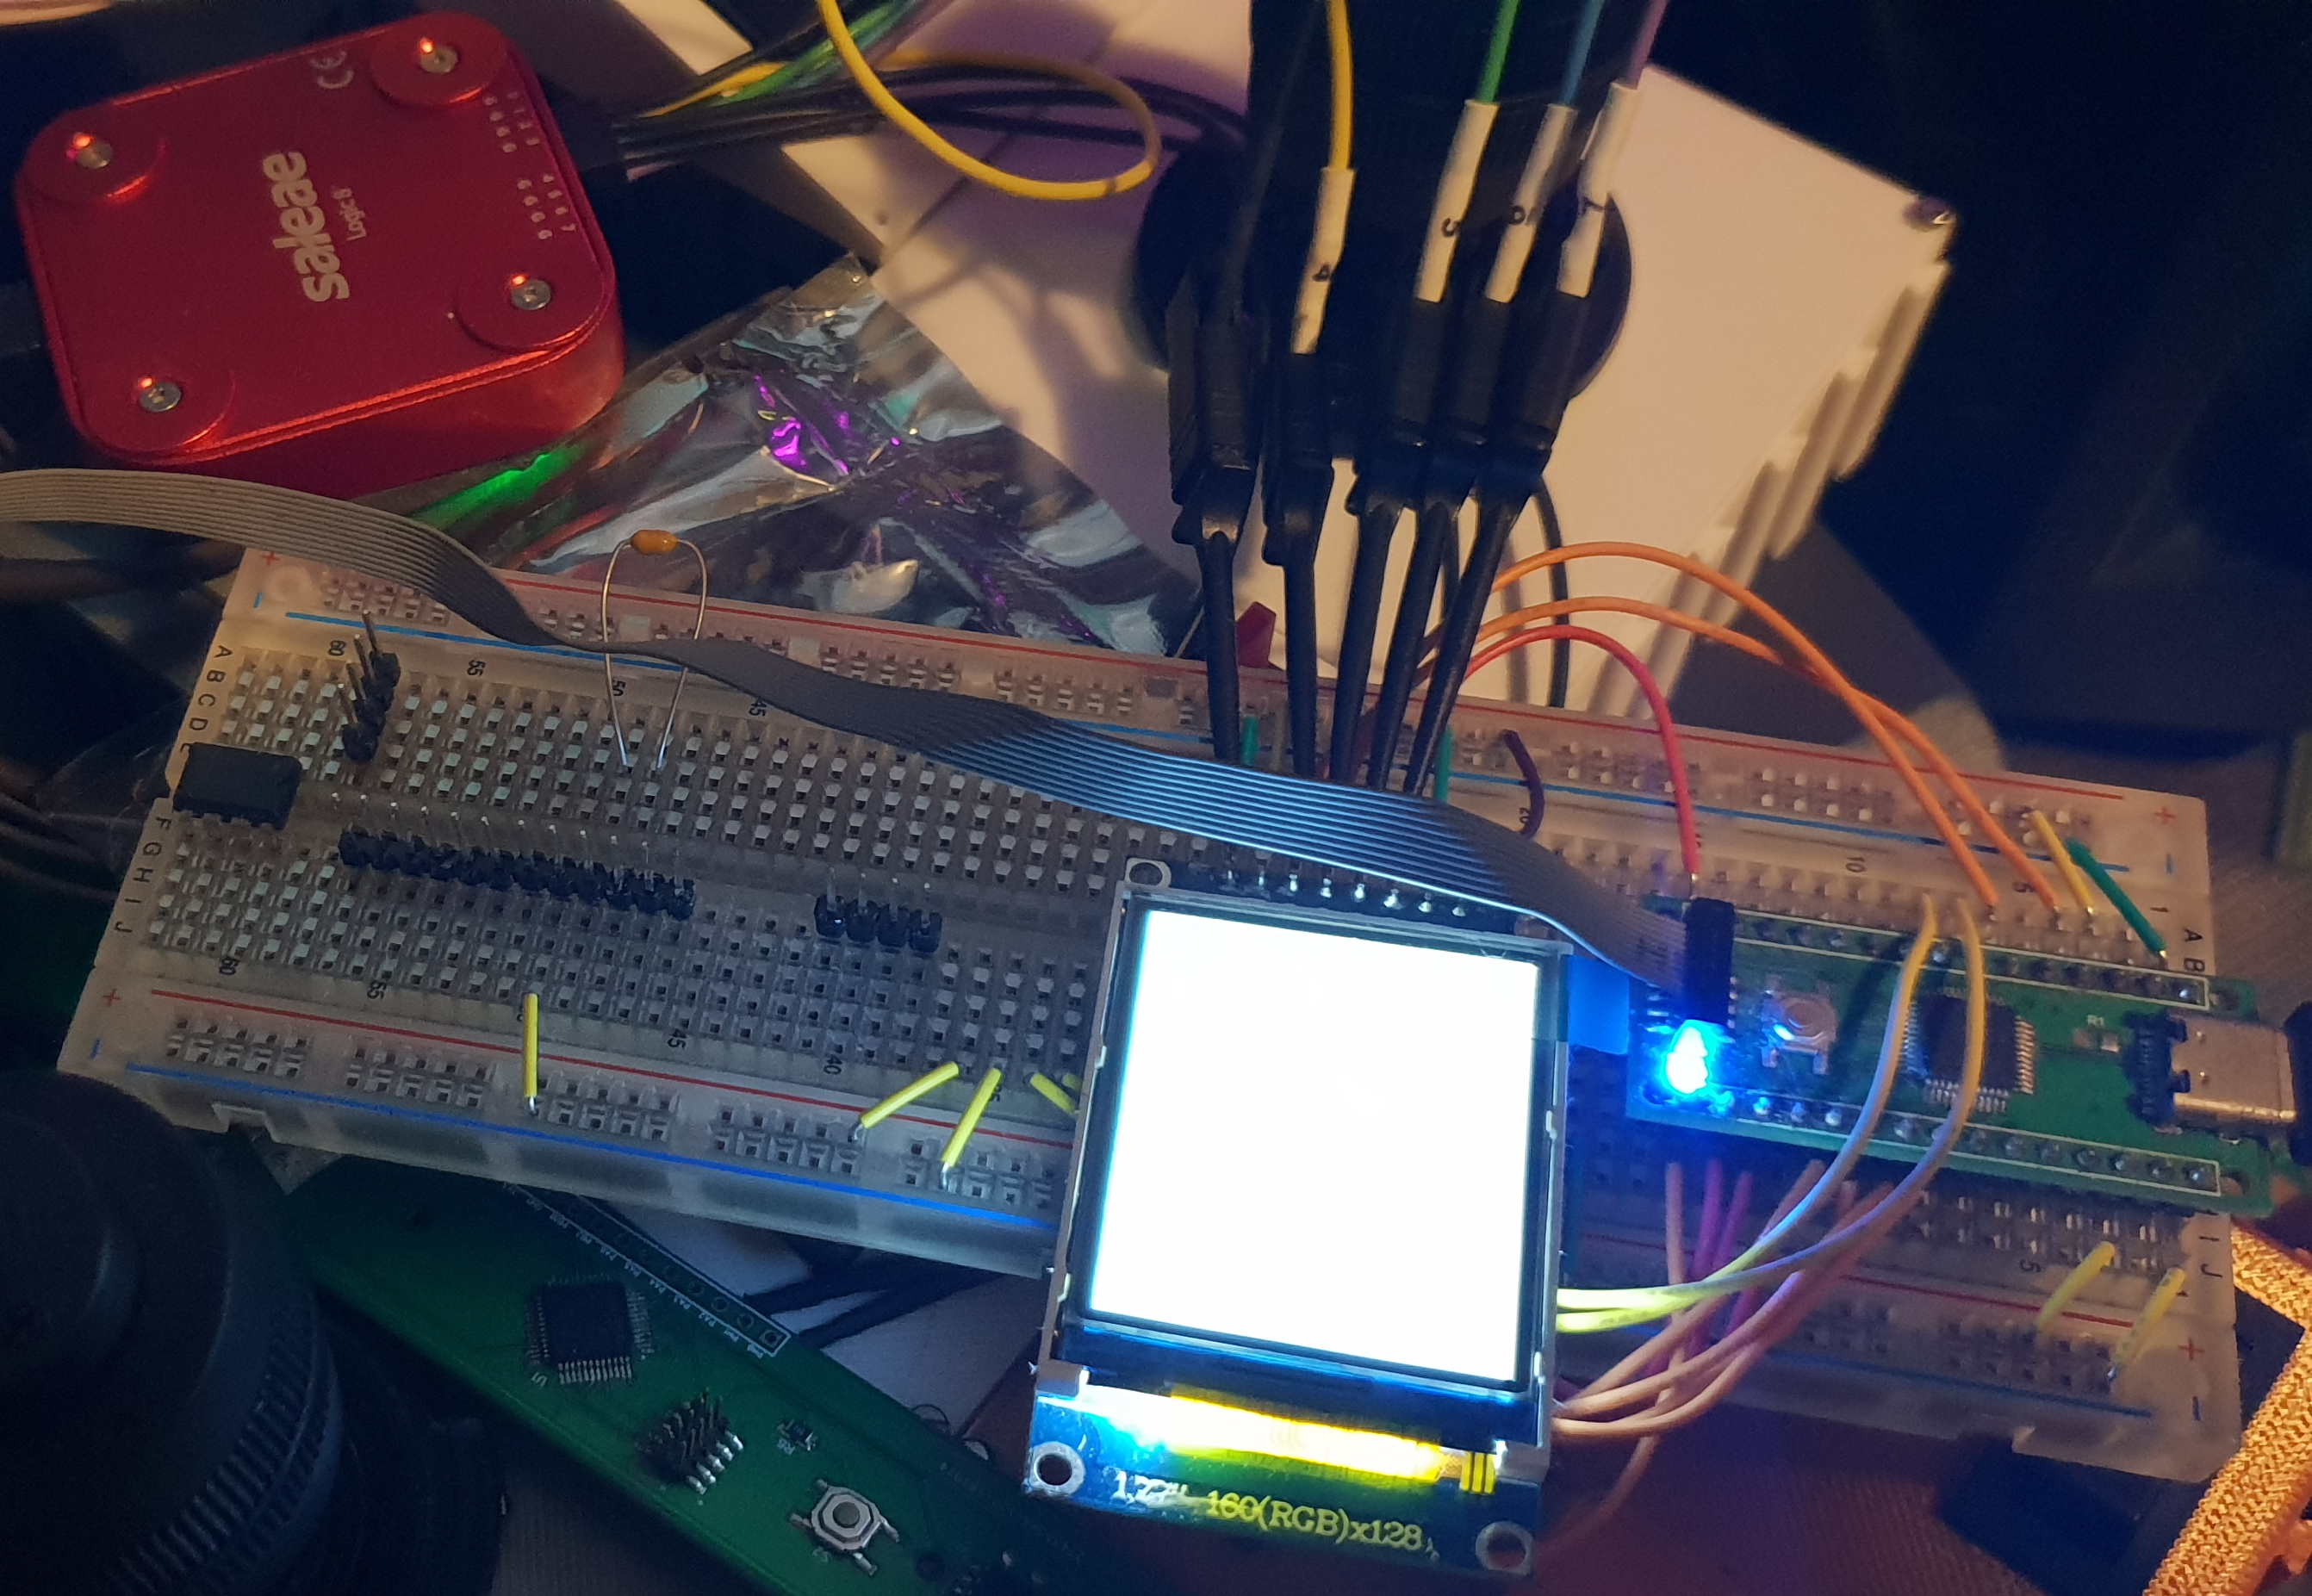
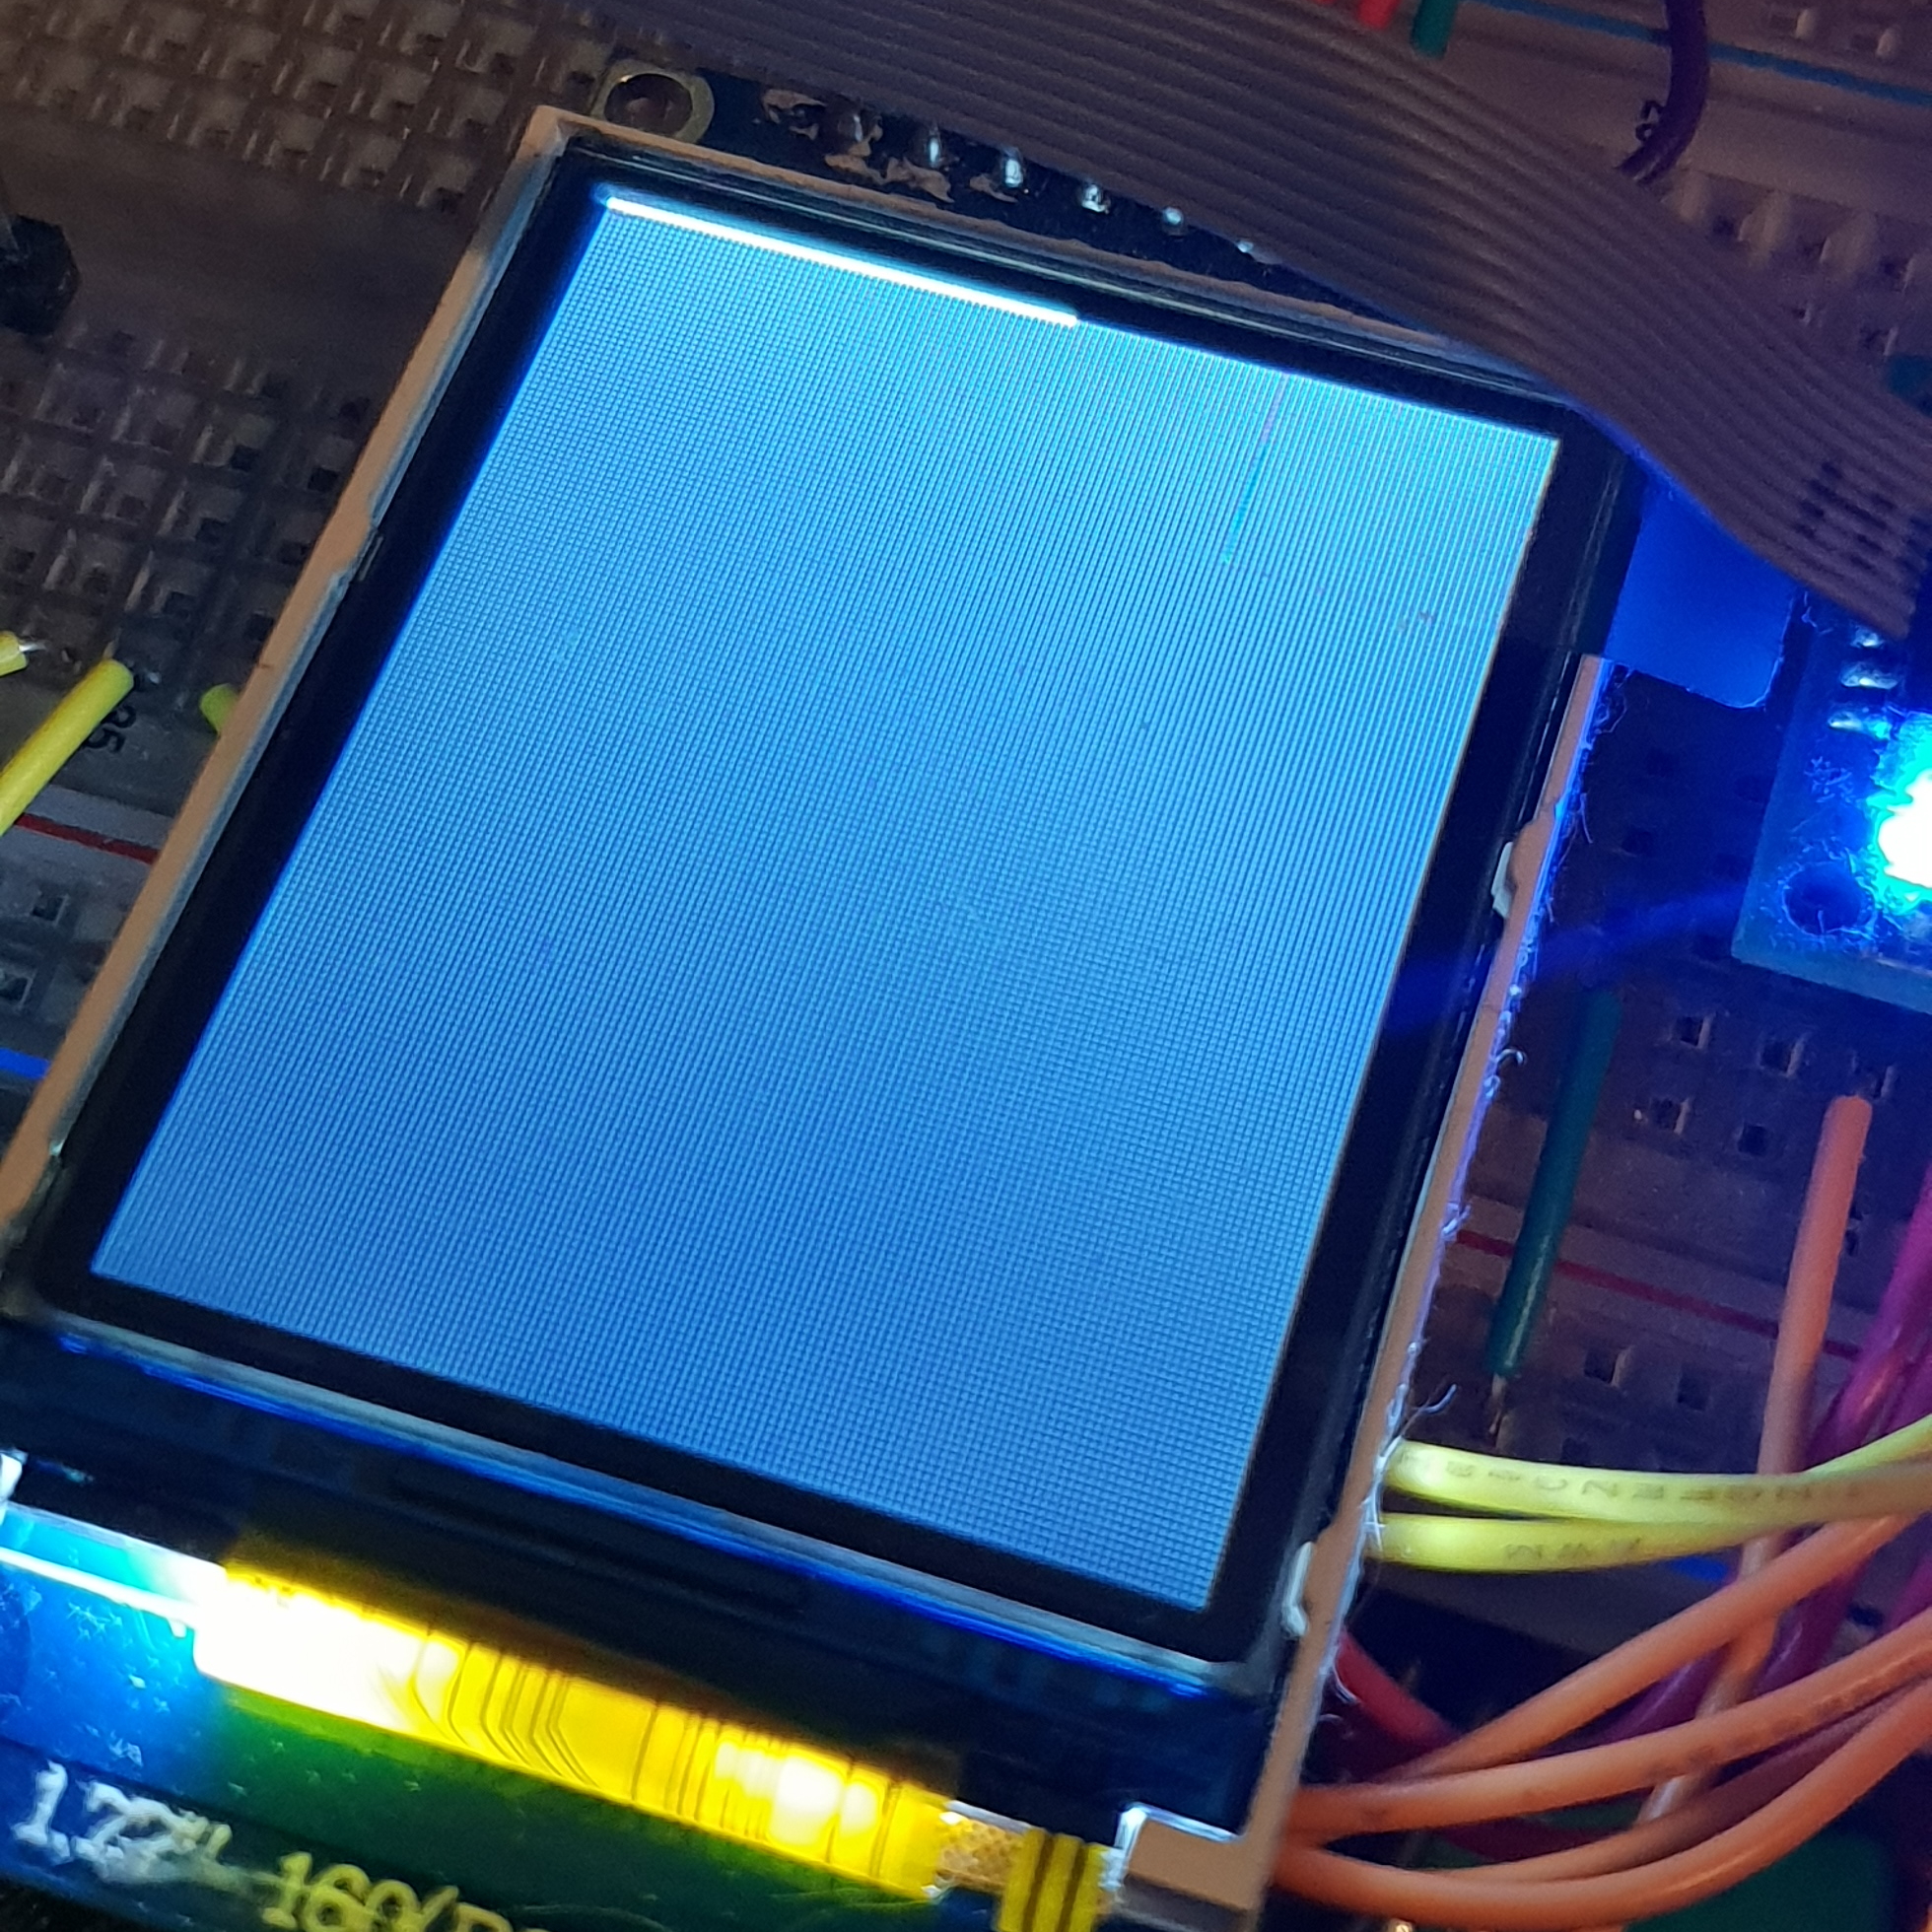
With the display initialized correctly, I could draw my first line!
Next came the choice of font to use. Unlike the LCDs I used for the object display earlier, the TFT display had no font ROM, so I would need to manually render text to pixels and transmit them. Given memory constraints, and size constraints, I settled on 5x8px as my standard character size and started to look for suitable fonts.
I found this repository of monospaced bitmap fonts and after some consideration I selected Spleen, as it had a very legible 5x8 implementation.

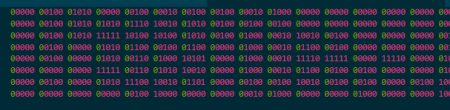
I converted an image containing the common ASCII characters in order, to binary, and then broke the raw binary into bytes for storage in the controller's flash memory, as a std::array of 8 std::arrays, each containing the pixel data for the corresponding row of all the characters.
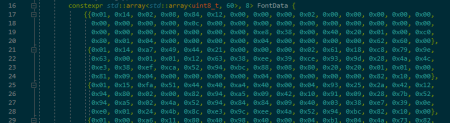
Storing the data in this way meant that I could calculate a fixed offset in bits for each character, by subtracting 0x20 from the raw ASCII value, then multiplying that by 5 (the character's width in pixels). I could then index the font data by row, and then by the fixed offset, to get the bits for a given character. After retriving the bits for a row, I could use each bit to know if the corresponding pixel should contain a color value, or black, and then write that resulting pixel into the specified destination buffer.
With that done, I could 'render' text to a pixel array, set the draw region on the display appropriately, and write text:
With text drawing (which, as I mentioned, was essentially the same as image drawing) implemented, I was ready to start implementing dynamic drawing of text and images over USB.
I initially implemented support for the following behaviour:
- The host-side software sends an OUT report, ID 5, which contains the palette data
- The device handles report 5 by:
- storing the palette data in RAM
- resetting the TFT display's internal address pointer and drawing region with the
CASET,RASETandRAMWRcommands
- The host-side software starts streaming packed pixel data as OUT report 6
- The device handles each incoming report 6 by :
- unpacking the packed data into proper 16-bit pixels using the palette as a lookup table
- writing the unpacked pixels to the display directly
The biggest problem with this implementation was that it relied on not receiving any other display-oriented reports while streaming pixel data. The display resets its internal address pointer when receiving a command, so if the microcontroller sent it any other command while streaming pixel data, the pixels following the command would be placed at the start of the draw region rather than resuming from the previous location.
As a result, care would have had to be taken to avoid interleaving different display reports together. In addition to this, to be as efficient as possible a larger amount of data would have to be transferred to the display at any given time. Because of the 64-byte packet size limitation on USB 1.1, this implementation required report 6 to be a multi-packet report, requiring the device to perform buffering of each packet until the length of received data matched the expected quantity before processing and displaying it.
The primary goal for streaming the data in the fashion described above, was to set the drawing region once, and thus avoid the overhead of CASET/RASET/RAMWR as much as possible, but in practice this implementation proved rather brittle.
If the device received a different report, even a non-display-related one, it could cause issues in the USB stack's buffering code by appearing in the middle of a larger multi-packet pixel report.
As a result, I altered the implementation somewhat:
- The host-side software sends OUT report 5 with palette data as before
- However the device simply stores that palette and does not communicate with the display
- The host then sends report 6 as self-contained single-packet transfers:
- The first byte indicates the type of data (pixel, or text)
- The second byte indicates which location the report contains data for
- The third byte contains the length
- The next 60 bytes contain actual pixel or text data
- Each report 6 is handled by being queued for later processing during the main loop by the TFT driver
The new implementation had extra overhead in that every report received required CASET/RASET/RAMWR to be sent to the display, but the reports could now be safely interleaved, and even theoretically could be received out-of-order.
The second and third bytes of each report ensured that each one was self-contained:
- For image reports, the index was the row index, and because the image was rectangular the length was always 60 (the width of a row)
- For text reports, the index was the text row index, and the length contained the number of characters (up to 19) that should be written to that row
At this point I had the drawing implementation functional, there was a problem. When receiving subtitle and image data from the host, even with each report now containing a smaller quantity of data, the data transmission code was still too slow, causing flickering on the multiplexed bar graphs and shift time displays. I didn't do any specific testing, but I also surmised that if it was slowing those displays down it was probably also introducing an unacceptable amount of latency into the code which checked the state of the analog and digital inputs, maybe even dropping some of those inputs. As a result, I'd need to look for ways to improve the performance further.
The first thing that I wanted to consider was the use of DMA. So far, I had been manually writing data from the transmission buffer to the SPI data register and then polling the appropriate registers to know when each transmission was complete. Polling is expedient when prototyping, but has obvious performance impacts, especially on an embedded system where there is no support for threads. DMA eliminates the need for polling by automating the process of moving data from the transmission buffer, to the data register, as soon as the peripheral requests it, and without requiring explicit control by the application software.
I pulled out the Saleae analyzer again so that I could profile the difference between a software transmission and one supported by DMA, to ensure that there wasn't some other factor at play that could cause the DMA transfer to be slower than a manual one.
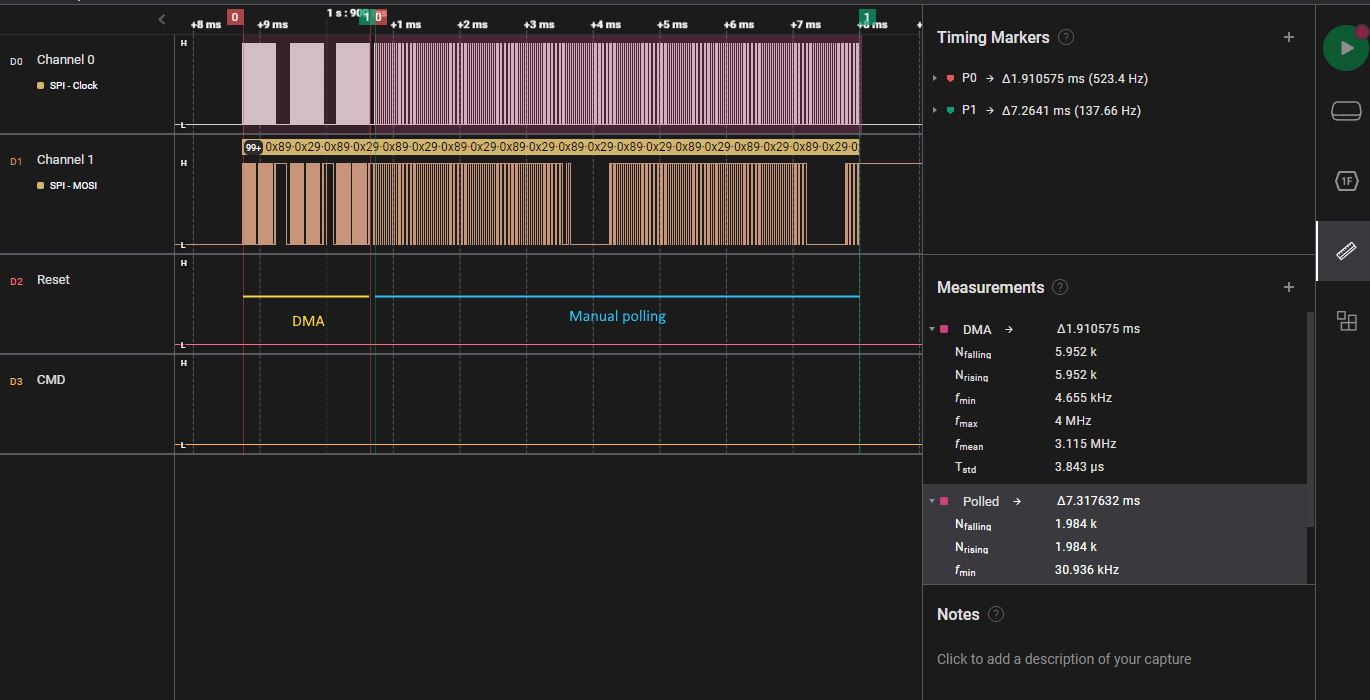
On first inspection of the polling implementation it became painfully obvious that the time spent polling between data frames was absolutely killing any semblance of performance I had during the transfer. With delays of up to 30 us between transfers, I was spending up to 15 times more time checking for when I could begin the next transfer, than was spent on the transfer itself!
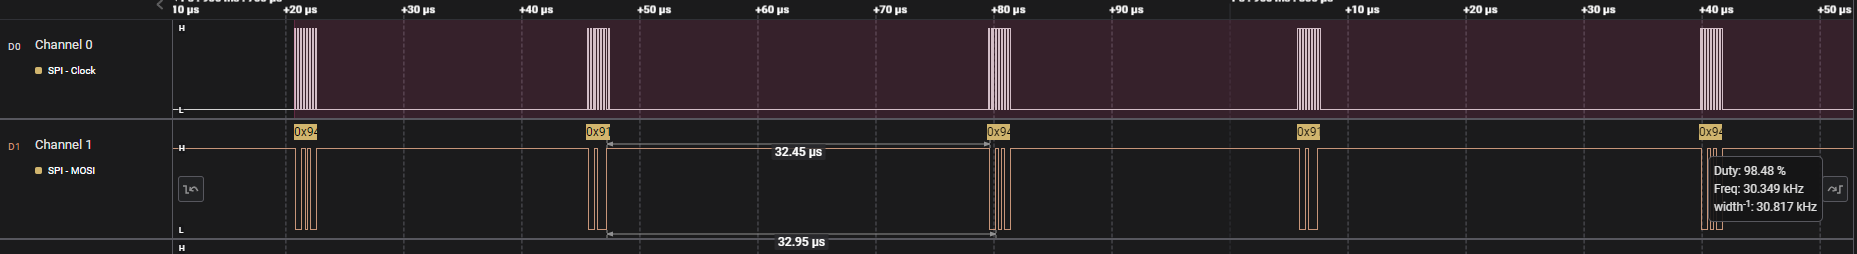
Polling being slow is probably entirely obvious to anybody who's written code before, but I must admit I was somewhat shocked at just how extreme this penalty was. This was only driven home harder when looking at the same set of data transmitted using DMA:
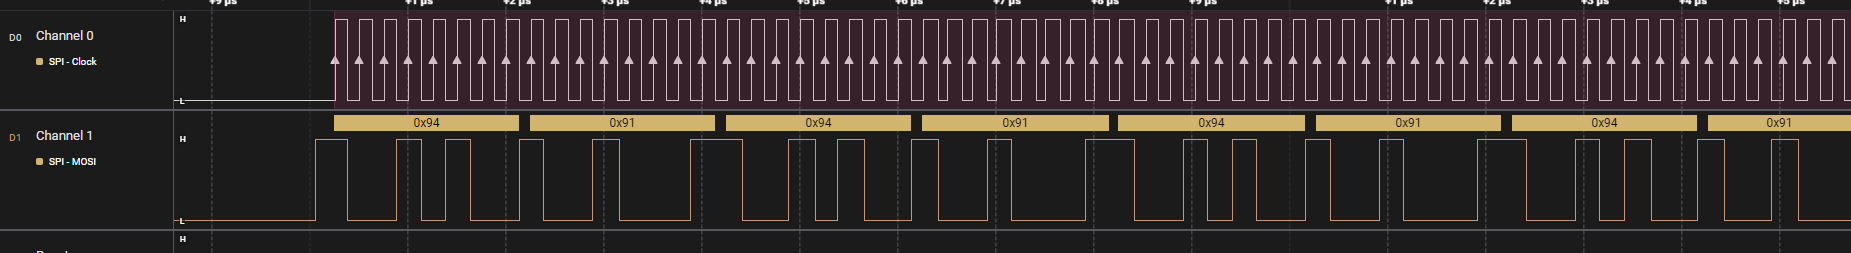
Absolutely no discernible gap between data frames, from what I could see. Using the measurement functionality built into the analyzer, I could compare the number of clocks (aka transmitted bits) and duration for each transmission type, and determine the speedup I was getting:
| Type | Duration(ms) | Number of Clocks/bits transferred | Effective bitrate |
|---|---|---|---|
| DMA | 1.91 | 5952 | 2.97 MiB/s |
| Polling | 7.31 | 1984 | 265 KiB/s |
This was approximately an 11.5x speedup, thanks to the time taken to set up each DMA transfer that was performed in my comparison data set.
Whilst this reduced the amount of time each transfer took significantly, I was still manually polling the flag to know when each DMA transfer completed, which really wasn't something I wanted to do. After all, the point of offloading work to the DMA controller is that the CPU can spend that time doing other things, like, in my case, updating the other displays.
In order to avoid needing to poll for the end of each DMA transfer I was going to have to go for something a bit more event-driven.
It may surprise readers who are primarily familiar with modern programming languages and desktop or web environments, but embedded microcontrollers have been following an asynchronous, event-driven model for decades.
Hardware-level events on a microcontroller are usually called interrupts, and on ARM Cortex-M devices like this chip, such events are controlled by two sources:
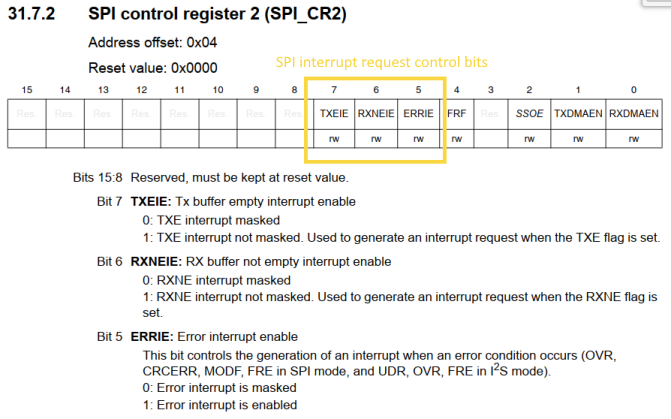
- Firstly, the peripheral in question usually has a dedicated interrupt control register, or dedicated bits in a control register for enabling and disabling the generation of each interrupt request, for example the following bits in the CR2 register for the SPI peripheral:
- Secondly, the core has what's called the Nested Vectored Interrupt Controller, or NVIC, which is responsible for enabling or disabling each interrupt and its priority, as well as allowing software to manually set the pending status for an interrupt
If an interrupt is enabled, when its state is set to pending, the interrupt will be triggered, and the 'interrupt handler' corresponding to that interrupt request number, or IRQn, will be executed by the system, unless the CPU is already executing code for an interrupt with higher priority. Lower priority interrupts being 'interrupted' by higher priority ones, is why the interrupt controller of Cortex-M devices is said to be 'nested'.
The interrupt controller is said to be 'vectored', because each interrupt has its own dedicated handler, rather than a single master interrupt handler which needs to check flags or registers to determine which interrupt caused the event to trigger.
The controller is able to do this, because each handler function has its address, a function pointer, stored in the 'vector table'. In Cortex-M devices this is at location 0x1 in memory (0x0 contains the initial stack pointer). When an event is triggered, the interrupt controller looks up the appropriate memory address for that request number, performs any context or stack saving that is required, and then jumps into that function.
This means that we need to generate the vector table of function pointers and ensure it is placed into the correct location in memory, usually by using a 'linker script'. I didn't particularly like the way that is done normally - most frameworks generate dummy/weak interrupt handlers for each IRQ and then request that the user override each one with their own implementation. Due to C++ having name mangling, these interrupt handlers are usually implemented as 'extern C' which gives them C linkage, disabling name mangling, but also placing restrictions on where and how they can be implemented.
In my framework, however, this is done slightly differently:
template<VectorTableEntry Index>
constexpr auto IRQHandler()
{
	return &EmptyHandler;
}

template<VectorTableEntry ...T>
struct TVectorTable
{
	static constexpr std::array<void(*)(), sizeof...(T)> data{ {IRQHandler<T>()...} };
};
I define a compile-time function template, which returns the address of my default do-nothing, loop forever, interrupt handler. This function template can be specialized (overridden) for each IRQ, which I have stored as the elements of the enum VectorTableEntry. The function's job is to return a pointer to the actual interrupt handler to invoke for a specific event.
I also define a templated struct which takes a list of VectorTableEntry enum values. This template generates a compile-time array consisting of the results of invoking the template function for each IRQ, ie the array contains the function pointer associated with each IRQ by the template specialization. This does have one limitation, in that it requires all IRQHandler specializations to be defined before the TVectorTable is instantiated, because if the compiler hasn't seen the specialization it will fall back on the default implementation here and use a pointer to EmptyHandler for that particular IRQ.
Adding the layer of indirection (a constexpr function returning the function pointer, rather than the function pointer directly) means that all of the IRQs without user specializations end up being stored in the table as pointers to EmptyHandler, rather than pointer to a technically unique specialization of the default handler instead.
I then specialize TVectorTable for the specific chip being used, because the order and number of each interrupt varies on the chip in question:
using VectorTableDescriptor = TVectorTable
<
	VectorTableEntry::Reset,
	VectorTableEntry::NMI,
	VectorTableEntry::Hardfault,
	VectorTableEntry::Empty,
	VectorTableEntry::Empty,
// <other entries snipped for brevity>
	VectorTableEntry::SPI2,
	VectorTableEntry::USART1,
	VectorTableEntry::USART2,
	VectorTableEntry::LPUART1_AES_RNG,
	VectorTableEntry::LCD,
	VectorTableEntry::USB
> ;
My linker script only defines a section called VectorTable which is placed into address 0x1. By only defining a section I dont have to worry about 'extern "C"', I just need to make sure that the vector table is the first/only object placed in that section.
This is easily done by using an attribute when I instantiate VectorTableDescriptor :
__attribute__((section(".VectorTable"), used)) constexpr auto static VectorTable = VectorTableDescriptor::data;
The STM32L073 exposes IRQs for DMA events like 'transfer complete', grouped by 'channel'. This meant that rather than polling for the end of the DMA transfer, I could implement an interrupt handler specialization, enable interrupts for DMA 'transfer complete' events, enable the interrupt for the DMA channel in question, and then just start the transfer. At some point in the future, when the transfer completed, the DMA hardware would trigger the 'transfer complete' interrupt, and my interrupt handler would then execute, to begin the next transfer or perform other processing.
This was fine in principle, but required me to be careful regarding 'interrupt-safety'. Because the Cortex-M0+ core in the STM32L073 doesn't support atomic compare-and-swap style operations, I needed to be careful with producing and queueing data in the USB packet interrupt (when data came from the host) and consuming that data(each time the DMA interrupt completed, I wanted to check if there was a new transfer to perform and start it if so).
Because the USB interrupt had higher priority (I deliberately gave it the highest priority, as there were timing issues to consider) it could interrupt the DMA interrupt handler, potentially overwriting or corrupting data while the DMA handler was processing it (for example while I was rendering text to a buffer for transmission). As a result, I wanted a data structure that would provide a degree of safety between the two interrupts (which aren't strictly threads in the sense of parallel execution, but can be thought of similarly from a concurrency perspective). I settled on this microcontroller-friendly ringbuffer library because it did not rely on the unsupported atomic operations mentioned earlier, was implemented in C++ and did not require any runtime memory allocation facility.
Implementing new versions of my SPI-Transmit-with-DMA functionality didn't take very long, as it mostly was a function of removing the polling/waiting code at the end of each function. I did run into a few issues with setting or clearing flags in the correct order to reset the DMA back to the correct state before beginning a new transfer, for example , you must clear the DMA channel's EN bit before trying to set the TCIE (transfer complete interrupt enable) bit, but otherwise was relatively straightforward.
Once that was done, the actual interrupt handler implementation was quite simple. Essentially it checked the ringbuffer/queue to see if there was a new data packet available, decoded it into the transmission buffer, initiated transmission and then returned. If there were no packets available, then the handler was essentially a no-op. The USB interrupt could then push packets in freely, whenever they were received, and the main loop's sole responsibility was to check if there were queued packets, and if so, manually trigger the DMA interrupt, so that the queue would begin to drain.
// DMA transfer complete handler
static void InterruptHandler()
{
	bProcessing = true;

	// Clear the interrupt
	NVIC_Control::ClearPendingIRQ<VectorTableEntry::DMAChannel2_3>();
	// Clear dma peripheral event flag
	DMA1::IFCR::CGIF3::write(DMA1::IFCR::CGIF3_Values::Clear);
	//Disable DMA channel 2
	DMA1::CH2_CR::EN::clear();
	// Wait for SPI to transmit last byte
	while (SPI1::SR::TXE::read() == SPI1::SR::TXE_Values::NotEmpty) {};
	while (SPIPeripheral::SR::BSY::is_set()) {};
	//Disable generation of DMA requests on SPI transmit
	SPIPeripheral::CR2::TXDMAEN::clear();


	if (DataQueue.readAvailable() > 0)
	{
		// fetch packet from queue
		// process it into transmission buffer
		// re-enable interrupts
		// initiate send
	}
	else
	{
		bProcessing = false;
	}
}

// In TFT display's 'tick' method
// If there's data in the queue and we aren't already draining the queue
if (DataQueue.readAvailable() > 0 && bProcessing == false)
{
	//Trigger processing the initial element in the queue and allow it to drain
	NVIC_Control::SetPendingIRQ<VectorTableEntry::DMAChannel2_3>();
}
Phew! After all that, performant host-side data processing, performant data transmission, performant drawing onto the screen. All done, right? Right?
Well, not quite.
I then went to test all this in the game, and immediately noticed some very odd behaviour. Straight after the flurry of DMA transfers and so on accompanying a request to draw an image on-screen, the joysticks began to generate very strange data.
I fired up my debugger and tried to inspect the data being sent by the joysticks. The difference was quite plain to see: During normal operation, the numbers on the right were being sent to the PC. So for example the fifth 16-bit value was representing the left stick's X axis value. However, after sending data to the device from the host requesting a new picture be drawn on-screen, the data looked like the version on the left side:
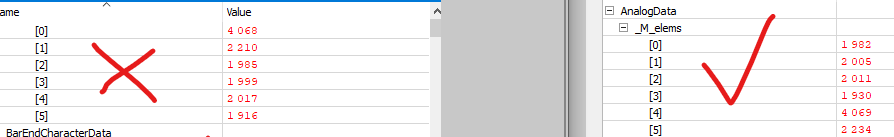
Notice how the high value had shifted position in the array? Clearly something was causing data transposition. I did some googling and found a number of other people experiencing similar behaviour, where they had an ADC operating with multiple channels being swept, and circular DMA to store the results, and somehow somewhere the order of channels was being altered.
The problem with my new display system, though, was that in order to debug the behaviour I had to pause the device's CPU, and that in turn caused timeouts on the host side in-game, which meant that the game stopped sending data to the device altogether.
I needed a way to observe the values being read from the ADC without halting the device's CPU. Enter SEGGER RTT.
SEGGER RTT is a special library you can include in your project that creates a static buffer in your device's RAM that can be read by SEGGER's host-side tools like Ozone, their debugger. It requires you to be using a J-link as your debug probe, but if you're not using a J-link on ARM Cortex-M devices I don't know what to tell you. SEGGER have a number of models aimed at hobbyists and educators like myself that are really affordable, they allow unlimited evaluation of many of their tools even for those using EDU or EDU-mini probes, they support basically every Cortex-M chip I know of, (and some other architectures too), so I'd encourage people to purchase the real thing.
Anyway, RTT includes an efficient implementation of printf which stores the resulting strings into this special static buffer where the host software can retrieve them. This meant that I could simply print out the ADC values continuously without pausing the device, pausing and stepping the game instead to control how much data and what type was being transmitted through to see if it caused the issue. Testing with my old, blocking manual polling SPI code showed that it didn't trigger the issue, so it was clearly something to do with my use of DMA. I then spotted this flag in the documentation for the ADC:
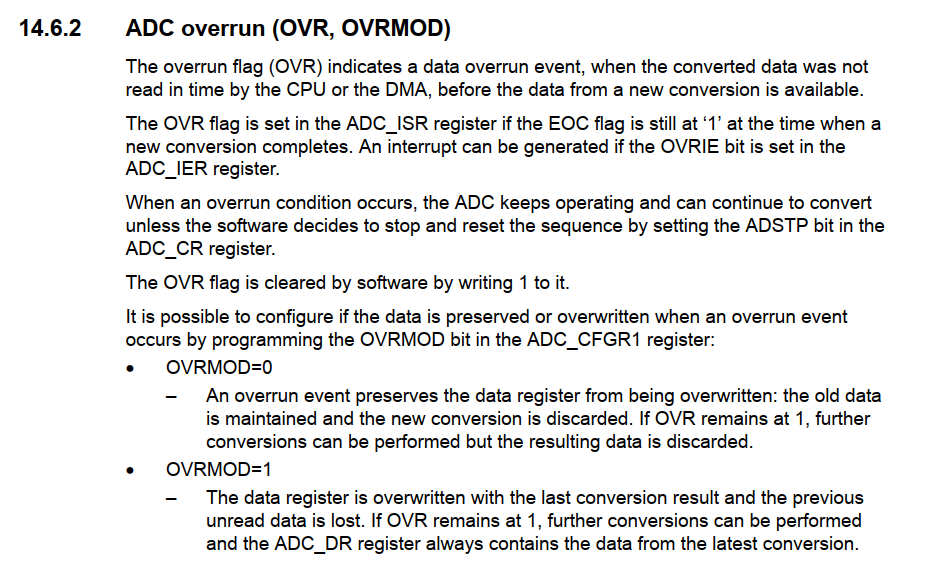
Sure enough, checking the value of the OVR flag indicated that the DMA controller was no longer able to keep up with the ADC once I configured the SPI to start making DMA requests as well. More advanced chips in this family potentially have two DMA controllers, but this chip only had one, and clearly contention between the ADC and the SPI was causing an overrun.
Looking through the way I had the ADC configured, I realised that I was requesting very very fast sampling rates. Far faster than was practical for the device itself, because even at the maximum speed a USB host will only request an IN report (containing the analog data from the thumbsticks) every 1ms. So there was no point sampling the ADC at a significantly higher frequency, especially when it was making the tight timing requirements for the DMA to service the request from the ADC after each sample was ready to store, even tighter.
The change ended up being quite simple, just the one line:
// Set the ADC clock rate to system clock divided by 4
ADC::CFGR2::CKMODE::write<ADC::CFGR2::CKMODE_Values::PCLK_Div4>();
By reducing the ADC clock rate from PCLK (the system clock rate), to PCLK/4, I reduced the speed at which the ADC made DMA requests by a factor of 4, easing bus contention and allowing the DMA much more time to respond to each request. Sure enough, after setting this I was no longer seeing the OVR flag being tripped and everything was functioning as expected.
Phew.
Hardspace: Shipbreaker Controller Implementation
Implementation breakdown pt 1: Hardware selection
Implementation breakdown pt 2: 20x4 LCD implementation
Implementation breakdown pt 3: PTZ joysticks
Implementation breakdown pt 4: Switches and buttons and bar graphs, oh my
- Implementation breakdown pt 5: Of TFTs, and scope creep